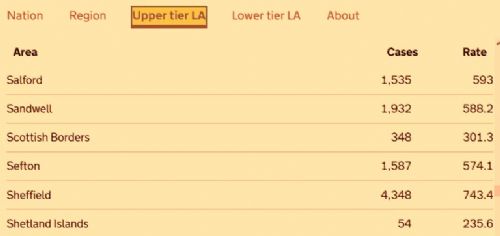
Salford has six new confirmed cases of coronavirus, bringing the cumulative total to 1,535, up from the previous day's 1,529.
Elsewhere in Greater Manchester, the latest case numbers show Manchester with a total of 3,483 (up from 3,460), followed by Oldham with 2,315 (up from 2,302), Wigan 2,209 (up from 2,205), Bolton 2,070 (up from 2,062), Rochdale 1,948 (up from 1,944), Stockport 1,821 (up from 1,814), Tameside 1,692 (up from 1,687), Trafford 1,485 (up from 1,479) and Bury 1,400 (up from 1,397).
There were no new virus-related deaths at Salford Royal Hospital.
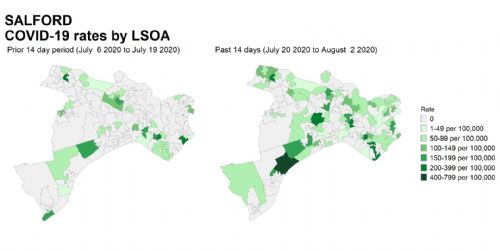
Meanwhile, Public Health England has released a map of COVID-19 rates in Salford per 100,000 population based on Lower Super Output Areas, which is more localised than the Middle Super Output Areas on its usual maps (see previous article – click here).
The two maps show the comparison between the 14 days 6th July and 19th July, and 20th July and 2nd August, with lots more cases in more areas of the city.
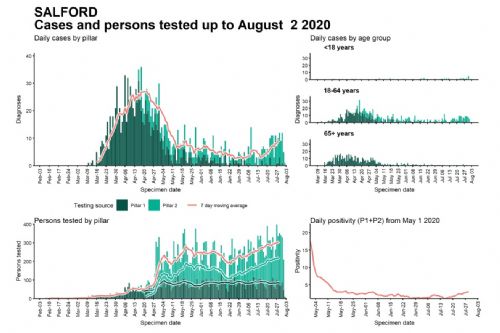
Public Health England has also produced graphs showing the number of people tested in Salford by day up to 2nd August, and how many of those tests were positive. If the seven day moving average line in red is compared between the number of tests and the number of cases, it can be noted that daily cases line is rising more sharply than the daily testing line.
It is the first time since the pandemic began that this level of detail for Salford has been released, and it has only being released for areas in the Local Authority Watchlist of interventions.




.jpg)


.jpg)
.jpg)
(3).jpeg)
.png)
(1).JPG)
