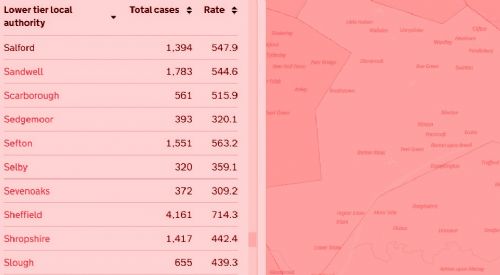
Salford has seven new confirmed cases of coronavirus, bringing the cumulative total to 1,394, up from the previous day's 1,387.
Elsewhere in Greater Manchester, Manchester now has a total of 3,084 cases (up from 3,068), followed by Wigan with 2,155 (up from 2,151), Oldham 1,986 (up from 1,961), Bolton 1,929 (up from 1,924), Rochdale 1,801 (up from 1,783), Stockport 1,672 (up from 1,665), Tameside 1,561 (up from 1,556), Trafford 1,334 (up from 1,317) and Bury 1,312 (up from 1,310).
Public Health England has now published a record of all virus outbreaks in care homes since March, and Salford has a total of 23 outbreaks out of 45 care homes, with none in the week of 13th July.
There have been no new virus-related deaths at Salford Royal Hospital.
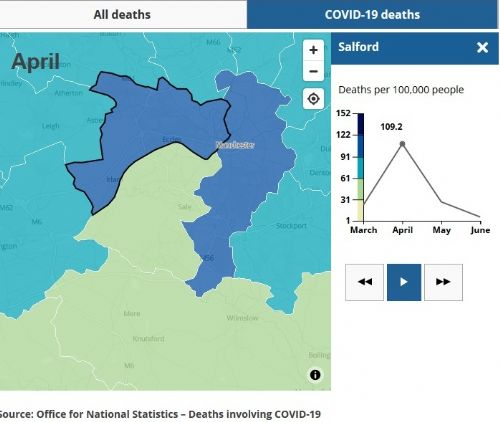
Meanwhile, the Office for National Statistics, or ONS, has created two maps of sad coronavirus deaths. The first shows age-standardised mortality rates per 100,000 people per month, with Salford showing 23.2 per 100,000 people in March, rising to 109.2 in April, then falling to 27.6 in May and 6.3 in June.
This week, Public Health England published a map of coronavirus cases by Middle Layer Super Output Areas (see previous Salford Star article - click here). Yesterday, the ONS produced an interactive map showing the number of sad deaths involving COVID-19 in Middle Layer Super Output Areas.
For Salford, it shows the highest number of deaths have sadly occurred in Higher Broughton (31), Broughton Park (25), Eccles (22), Little Hulton North (22), Swinton Worsley Road (19), Worsley (19) and Weaste and Seedley (18).
Here is the full list of overall deaths, followed by deaths in June. The Salford Star totally respects that each of these deaths are more than mere statistics and are real people from real families in our community...
Deaths between March and 30th June 2020...
Higher Broughton: 31 overall June: 3
Broughton Park: 25 overall June: 2
Eccles: 22 overall June: 0
Little Hulton North: 22 overall June: 0
Swinton Worsley Road: 19 overall June: 0
Worsley: 19 overall June: 0
Weaste and Seedley: 18 overall June: 2
Higher Irlam: 13 overall June: 0
Lower Irlam and Cadishead: 13 overall June: 0
Walkden North West: 13 overall June: 0
Lightoaks: 12 overall June: 0
Langworthy Buile Hill: 11 overall June: 1
Barton upon Irwell: 11 overall June: 0
Little Hulton South: 10 overall June: 0
Clifton: 8 overall June: 0
Walkden South: 7 overall June: 1
Kersal Dale: 7 overall June: 0
Pendleton: 7 overall June: 1
Swinton West: 7 overall June: 0
Peel Green: 6 overall June: 0
Walkden North East: 6 overall June: 0
Ellenbrook and Boothstown: 5 overall June: 0
Clifton Green and Pendlebury East: 5 overall June: 1
Swinton Newtown: 5 overall June: 1
Salford Central and University: 4 overall June: 0
Ordsall and Salford Quays: 3 overall June: 0
Patricroft: 3 overall June: 0
Cromwell Road and Broad Street: 2 overall June: 0
Winton and Westwood: 2 overall June: 0
Swinton South East and Pendlebury West: 1 overall June: 0
The ONS comments that "the non-London local authorities with the highest age-standardised mortality rates remain unchanged; these were Middlesbrough with an age-standardised mortality rate of 178.0 deaths per 100,000 people, Hertsmere with a rate of 166.7 deaths per 100,000 people and Salford with a rate of 166.2 deaths per 100,000 people. These mortality rates were also statistically significantly higher than the England and Wales average..."
To see the full interactive map on the ONS website – click here and scroll right down until it appears


.jpg)


.jpg)


.jpg)
.jpg)
(3).jpeg)
.png)
(1).JPG)
