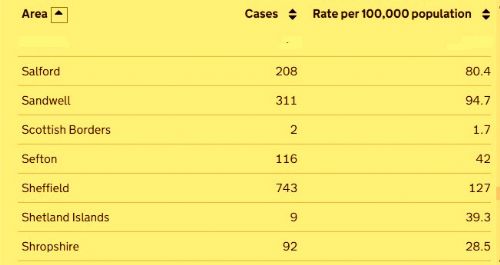
Salford has 31 new coronavirus cases, up from the previous day's 22, bringing the cumulative total to 22,843. The seven day average of cases in Salford is now 208, down from 224, while the seven day rate per 100,000 population now stands at 80.4, down from 86.5.
Elsewhere in Greater Manchester, the seven day average of cases in Bury is 145 (down from 167), with a seven day rate per 100,000 population of 75.9 (down from 87.4); Bolton 297 (same), with a rate of 103.3 (same); Manchester 521 (up from 488), with a rate of 94.2 (up from 88.3); and Oldham 253 (up from 252), with a rate of 106.7 (up from 106.3).
Rochdale has a seven day average of cases of 226 (down from 242), with a seven day rate of 101.6 (down from 108.8); Stockport 238 (up from 230), with a rate of 81.1 (up from 78.4); Tameside 246 (down from 247), with a rate of 108.6 (down from 109.1); Trafford 123 (up from 118), with a rate of 51.8 (up from 49.7); and Wigan 330 (up from 323), with a rate of 100.4 (up from 98.3).
There have been no new virus-related deaths announced by Salford Royal Hospital.
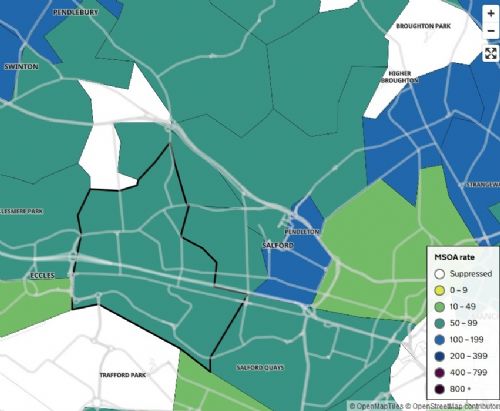
Meanwhile, the latest Government interactive map of areas for the week ending 24th March shows the seven day rolling infection rates in Salford per 100,000 population. Area with the lowest rates of infection were Broughton Park, and Swinton South East and Pendlebury West with less than three cases.
Other areas with low rates include...
Barton Upon Irwell – 3 cases 45.7 rolling rate
Worsley – 3/31
Salford Central and University – 5/33
Peel Green – 5/42
Lower Irlam and Cadishead – 4/38.3
Ellenbrook and Boothstown – 5/48.2
Areas with the highest rates include...
Walkden North East – 12 cases 177.5 rolling rate
Clifton 8/135
Little Hulton North – 11/131.4
Little Hulton South – 9/126.1
To view the interactive map - click here and enter a postcode





.jpg)


.jpg)
.jpg)
(3).jpeg)
.png)
(1).JPG)
