Salford has 103 new coronavirus cases, down from the previous day's 111, bringing the cumulative total to 19,597. The seven day average of cases has decreased to 842, down from 855, while the seven day rate per 100,000 population now stands at 325.3, down from 330.3.
Elsewhere in Greater Manchester, the seven day average of cases in Bury is 535 (down from 558), with a seven day rate per 100,000 population of 280.1 (down from 292.2); Bolton 857 (down from 905), with a rate of 298 (down from 314.7); Manchester 1,794 (down from 1,819), with a rate of 324.5 (down from 329); and Oldham 604 (up from 593), with a rate of 254.7 (up from 250.1).
Rochdale has a seven day average of cases of 619 (down from 620), with a seven day rate of 278.3 (down from 278.8); Stockport 814 (down from 847), with a rate of 277.4 (down from 288.7); Tameside 677 (down from 716), with a rate of 298.9 (down from 316.1); Trafford 647 (down from 681), with a rate of 272.6 (down from 286.9); and Wigan 974 (down from 1,051), with a rate of 296.4 (down from 319.8).
There have been two new virus-related deaths at Salford Royal Hospital.
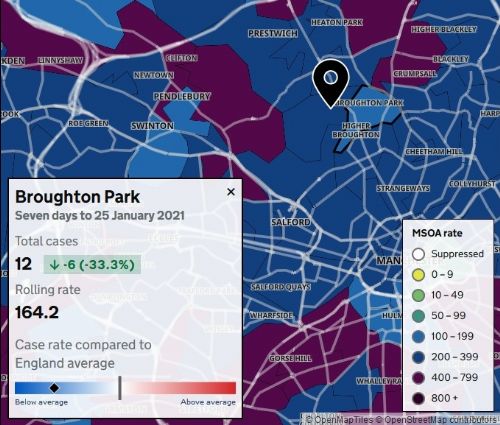
Meanwhile, the latest map of virus cases for Salford, week ending 25th January, shows Patricroft as having the highest 7 day rolling rate of infections in the city, with Broughton Park having the lowest.
The areas with the highest 7 day rolling rate of cases are...
Patricroft – 485.9 (33 new cases)
Higher Irlam – 452.5 (45 new cases)
Clifton Green and Pendlebury East – 437.7 (34 new cases)
Lightoaks – 430.4 (24 new cases)
Walkden North East – 414 (28 new cases)
Clifton - 404.9 (24 new cases)
The areas with the lowest 7 day rolling rates of cases are...
Broughton Park – 164.2 (12 new cases)
Swinton Worsley Road – 198.3 (19 new cases)
All other areas have rolling rates between 200 and 400.
To view the interactive case map – click here and enter a postcode




.jpg)


.jpg)
.jpg)
(3).jpeg)
.png)
(1).JPG)
