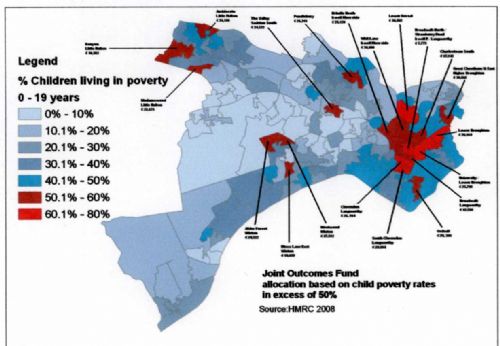
A new map of child poverty in Salford reveals rates hitting almost 75% in the Broadwalk North/Strawberry Road area, 69% in Clarendon, almost 66% in South Clarendon, almost 68% in Lower Broughton and just over 63% in Lower Kersal.
These are the five worst areas of Salford for child poverty, with parts of Langworthy, Ordsall, Whit Lane, Charlestown, Little Hulton, Winton and Pendlebury not too far behind.
The map is included in a new Salford Council report which admits that the budget for funds to help young people in poverty has been halved from £1.4million last year, to £700,000 for this financial year, and adds that it "may experience more reductions next year".
In the meantime, the £700,000 Joint Outcomes Fund aims to target the most deprived young people in the city – but a whopping £210,000 of that budget is being swallowed up by what the Council calls "existing commitments" and "commissioning and monitoring activity". This leaves £490,100 to be awarded to schemes run by third sector organisations in twenty areas of the city with child poverty rates over 50%.
What is incredible is that many of the areas with the worst child poverty have actually had hundreds of millions of pounds worth of regeneration money pumped into them.
For instance, Whit Lane (58.8% child poverty), Charlestown South (52.3%), Lower Kersal (63.1%) and Broadwalk North/Strawberry Road (74.4%) were within the Charlestown and Lower Kersal New Deal For Communities area. This ten year £53million project which finished last March was specifically aimed at reducing such factors as child poverty. To say it's been a failure would be an understatement.
The poverty figures are taken from the year 2008. We can only assume that since then, due to ConDem Government and Salford Council cuts, the child poverty rates are getting worse.
THE TOP TWENTY WORST CHILD POVERTY AREAS IN SALFORD
1. Broadwalk North/Strawberry Road (Irwell Riverside) 74.4%
2. Clarendon (Langworthy) 69%
3. Lower Broughton/University (Irwell Riverside) 67.8%
4. South Clarendon (Langworthy) 65.7%
5. Lower Kersal (Kersal) 63.1%
6. Lower Broughton (Broughton) 62.8%
7. Amblecote (Little Hulton) 59%
8. Whit Lane (Irwell Riverside) 58.8%
9. Kenyon (Little Hulton) 58.2%
10. Brindle Heath (Langworthy) 57%
11. Moss Lane East (Winton) 56.6%
12. Westwood (Winton) 53.7%
13. Great Cheetham Street East (Broughton) 53.5%
14. Ordsall (Ordsall) 53.1%
15. Charlestown South (Irwell Riverside) 52.3%
16. Alder Forrest (Winton) 52.3%
17. The Valley (Swinton South) 52.2%
18. Broadwalk (Langworthy) 52.2%
19. Pendlebury (Pendlebury) 50.9%
20. Madamswood (Little Hulton) 50.1%
• Name of ward in brackets.
• Source: HMRC 2008




.jpg)


.jpg)
.jpg)
(3).jpeg)
.png)
(1).JPG)
